
As a senior Magento 2 developer, one of the essential skills you need in your toolbox is the ability to efficiently debug your code. Magento Cloud, a powerful cloud-based hosting platform for Magento applications, requires a specialized approach to debugging. In this blog post, we will explore how to set up and use Xdebug with PhpStorm to effectively debug a Magento Cloud-based application.
Prerequisites
Before diving into the configuration steps and debugging process, ensure you have the following prerequisites in place:
- A Magento Cloud account with SSH access.
- PhpStorm installed on your local development environment.
- Xdebug extension installed on the Magento Cloud environment.
Configure Xdebug on Your Environment
Before going forward, you need to make sure your environment is running Xdebug. There is helpful information on the official documentation page on how to set it up in your environments.
As the documentation says:
On Pro Staging & Production environments, Xdebug is always available as these environments have a special setup for Xdebug. All normal web requests are routed to a dedicated PHP process that does not have Xdebug. Therefore, these requests are processed normally and are not subject to the performance degradation when Xdebug is loaded. When a web request is sent that has the Xdebug key, it is routed to a separate PHP process that has Xdebug loaded.
This means that you don’t need to worry about configuring it on Magento Cloud Pro Plans, to either staging or production because they are already enabled by default. But if you are running a Magento Cloud Starter Plan, in a nutshell, you need to make two simple changes:
First, you have to make a change to the file .magento.app.yaml. This file controls some aspects of how your environment will be, like which PHP version is going to be deployed, which PHP extensions, etc. Add the xdebug entry for the runtime section of this file.
runtime:
    extensions:
        - redis
        - xsl
        - newrelic
        - sodium
        - xdebug
Second, save the file, commit this change, and push it to your Magento Cloud repository to start a deployment to the environment. This change will ensure the Xdebug is enabled on your environment.
Get the Xdebug Session ID from the Cloud Environment
It’s very important to have this information for configuring your Xdebug Helper browser extension and PhpStorm correctly. By taking the following steps, you’ll be able to grab this information from the environment to use it on your configuration.
SSH into your Magento Cloud Environment
If you have the magento-cloud CLI installed on your local environment, simply type the following command on your terminal:
> magento-cloud ssh -e [production/staging/integration]
If you don’t know about it yet and want to learn more, just check the official documentation page. It’s a powerful and required CLI tool for developers who work with Magento Cloud projects.
If you don’t have it installed, you can SSH by using the SSH command directly. Just make sure you have the proper access for doing that.
You’ll get into the server:

When you’re in, run the following command from inside the Magento Cloud server:
cat /etc/platform/*/nginx.conf | grep xdebug.sock | head -n1
This will give you a result like the following one:

In our case, the Session ID is XWh4SLW0tF7ACQ2H. Make sure you save this information safely so that you can use it later.
Install and Configure the Xdebug Helper on Your Browser

The Xdebug Helper browser extension is a valuable tool for developers who use Xdebug for debugging their applications. In summary, the Xdebug Helper browser extension acts as a bridge between your browser and the Xdebug debugging functionality. It offers convenient controls and features that facilitate the debugging process, including starting and stopping debugging sessions, managing cookies, controlling profiling and tracking, configuring remote debugging, and integrating with IDEs. Installing the Xdebug Helper extension enhances your debugging workflow and makes it more efficient and productive.
To install the Xdebug Helper to your Google Chrome, go to the Chrome Web Store and search for Xdebug Helper:

If you’re using Firefox, the procedure is almost the same, but you go to the Firefox Browser Add-Ons page instead.

Once you have it installed and enabled on your browser, it’s time to configure it. Right-click on the extension icon and click on Options. All you need to change here is the IDE Key section. Just select Other, add the Session ID, and click on the Save button:

Configuring PhpStorm
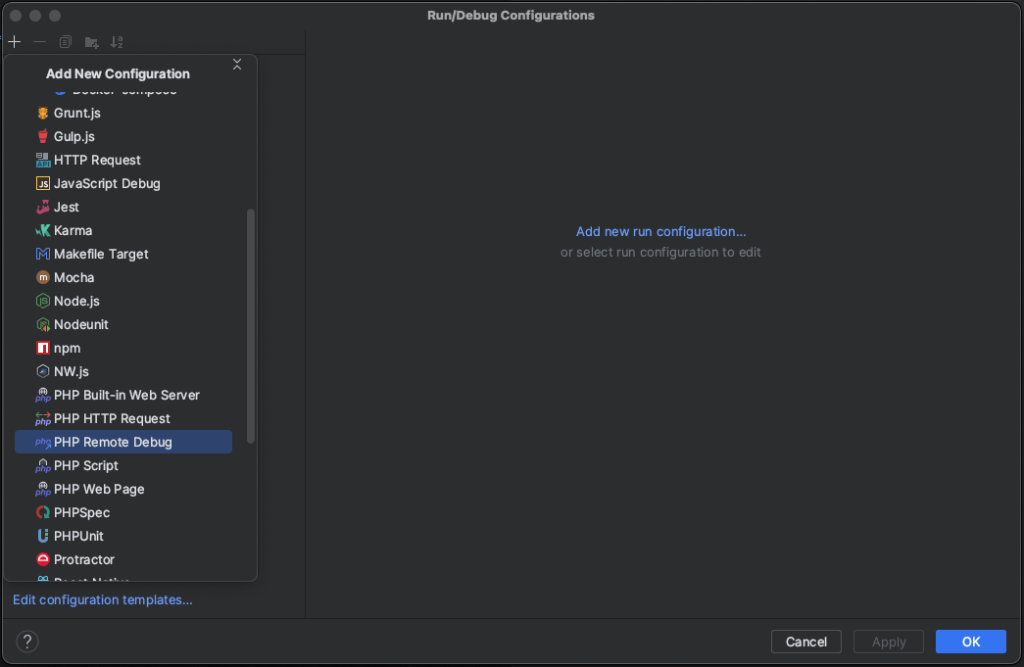
On the PhpStorm side, you’ll need to configure the debug parameters. On the right top hand click on the Current File field > Edit Configurations…

Click on the plus sign and click on the PHP Remote Debug configuration option.
Give it a name and place the IDE Key or Session ID on the following field.

Now it’s time to create a server configuration. Click on the three-dot button on the right side of the Server field and fill in the configuration according to the screen below:

- Give it a name.
- Host: localhost
- Port: 443
- Mark the Use path mappings option
- On the absolute path on the server, insert the directory path of the Magento application inside the Magento Cloud server, (e.g. /app/xxxxxxxxx_stg/). You only need to fill it in for the project files mapping. The rest can be empty.
The final result will be something like the following.

Now that you have the Xdebug configured on your PhpStorm, you’ll see the following fields.

Click on the green bug icon to start listening to the Xdebug server.

Now your PhpStorm is listening to the Xdebug server connection.
Setup Port Forwarding
In this step, you’ll need to have all the 3 server SSH addresses on hand and create an SSH tunnel to all of them at the same time, so any request you make to Magento will connect to your PhpStorm.
You may ask me why you need to listen to the three servers at the same time and that’s because in a Pro Architecture, you have three different server instances for performance improvement on either staging or production environments.
On the top of the architecture and under Fastly (A Full Page Cache and DDos Protection service which is bundled with the Magento Cloud plans), we have an Elastic Load Balancer, which has the responsibility of spreading all the traffic from the website between all the three server instances.
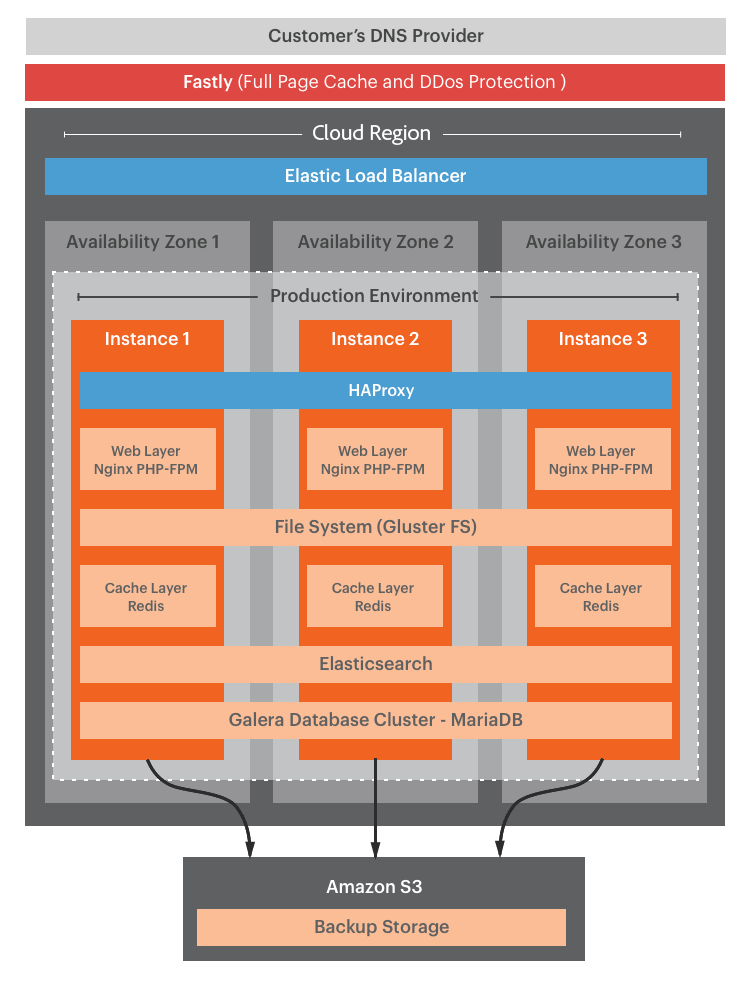
That means if you have 90 requests to the website, most probably each server instance will receive and handle 30 of them. Based on this principle, if you only listen to one server instance, when you access the website for testing and debugging purposes, the chances of your debugging requests being handled by the right server, which means, the server you’re connected to, is about 33.33%, so 66.66% of your requests would not hit a debugging server instance. If you connect to the three instances at the same time, all of your requests may hit a debugging server instance and your debugging process will be more efficient.
Getting back to our tutorial, the server SSH addresses look like the following:
Tip: if you’re not sure where you can grab those SSH addresses from, you can use a Magento Cloud CLI command for that.
magento-cloud environment:ssh --all
Enter a number to choose an environment:
Default: master
[0] Integration (integration) (type: development)
[1] Master (master) (type: development)
[2] phase-two-integration (type: development)
[3] Production (production)
[4] Staging (staging)
> 4
[email protected]
[email protected]
[email protected]
Now you’ll need to open three different tabs on your terminal and run the following commands on each of them. We’re gonna use port 9000.
Terminal Tab 1
ssh [email protected] 'rm /run/platform/xxxxxxxxxxxxx_stg/xdebug.sock'
ssh -R /run/platform/xxxxxxxxxxxxx_stg/xdebug.sock:localhost:9000 -N [email protected]
Terminal Tab 2
ssh [email protected] 'rm /run/platform/xxxxxxxxxxxxx_stg/xdebug.sock'
ssh -R /run/platform/xxxxxxxxxxxxx_stg/xdebug.sock:localhost:9000 -N [email protected]
Terminal Tab 3
ssh [email protected] 'rm /run/platform/xxxxxxxxxxxxx_stg/xdebug.sock'
ssh -R /run/platform/xxxxxxxxxxxxx_stg/xdebug.sock:localhost:9000 -N [email protected]

Now, it’s time to test. On your browser, first click on the Xdebug Helper icon and then click on Debug.

Now, on the PhpStorm, create a breakpoint on the pub/index.php file just to make sure your PhpStorm will listen to the request and stop on it. Now, open the Magento website on the browser and see the magic happens.

Conclusion
With all the complexity of the PHP applications today, Xdebug is a mandatory tool for developers that need a professional and efficient tool for debugging their PHP applications, not only Magento. By following the steps above you’ll be able to save a ton of time debugging your Magento application efficiently with Xdebug and identify the root cause of that bugs that only happen on the production or staging environments.
I hope this tutorial helps you as much as it helps me every day I need to deal with weird environmental bugs.
If you have any further questions, just a leave comment.
You can buy me a coffee later. 🙂

Thank you very much! That helped a lot more than Adobe’s documentation
LikeLiked by 1 person
I’m glad it helped you out, Arthur.
LikeLike